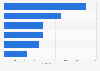
This statistic presents the mobile app install fraud rate in the United States and worldwide from January to October 2018. During the last measured month, more than one quarter of paid app installs worldwide were fraudulent.
Profit from the additional features of your individual account
Currently, you are using a shared account. To use individual functions (e.g., mark statistics as favourites, set
statistic alerts) please log in with your personal account.
If you are an admin, please authenticate by logging in again.
Learn more about how Statista can support your business.
eMarketer. (May 10, 2018). Mobile app install fraud rate in the United States and worldwide from January to October 2018 [Graph]. In Statista. Retrieved June 03, 2025, from https://www.statista.com/statistics/946798/paid-app-install-fraud-rate-worldwide-usa/
eMarketer. "Mobile app install fraud rate in the United States and worldwide from January to October 2018." Chart. May 10, 2018. Statista. Accessed June 03, 2025. https://www.statista.com/statistics/946798/paid-app-install-fraud-rate-worldwide-usa/
eMarketer. (2018). Mobile app install fraud rate in the United States and worldwide from January to October 2018. Statista. Statista Inc.. Accessed: June 03, 2025. https://www.statista.com/statistics/946798/paid-app-install-fraud-rate-worldwide-usa/
eMarketer. "Mobile App Install Fraud Rate in The United States and Worldwide from January to October 2018." Statista, Statista Inc., 10 May 2018, https://www.statista.com/statistics/946798/paid-app-install-fraud-rate-worldwide-usa/
eMarketer, Mobile app install fraud rate in the United States and worldwide from January to October 2018 Statista, https://www.statista.com/statistics/946798/paid-app-install-fraud-rate-worldwide-usa/ (last visited June 03, 2025)
Mobile app install fraud rate in the United States and worldwide from January to October 2018 [Graph], eMarketer, May 10, 2018. [Online]. Available: https://www.statista.com/statistics/946798/paid-app-install-fraud-rate-worldwide-usa/