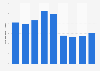
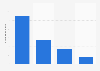
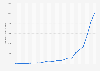
This statistic depicts the share of malware detected across Asia Pacific in 2016/2017, by type. In this period, viruses and worms accounted for around ** percent of the malware detected across the Asia Pacific region.
Profit from the additional features of your individual account
Currently, you are using a shared account. To use individual functions (e.g., mark statistics as favourites, set
statistic alerts) please log in with your personal account.
If you are an admin, please authenticate by logging in again.
Learn more about how Statista can support your business.
NTT Security. (May 25, 2018). Share of malware detected across Asia Pacific in 2016/2017, by type [Graph]. In Statista. Retrieved July 12, 2025, from https://www.statista.com/statistics/946831/asia-pacific-malware-share-by-type/
NTT Security. "Share of malware detected across Asia Pacific in 2016/2017, by type." Chart. May 25, 2018. Statista. Accessed July 12, 2025. https://www.statista.com/statistics/946831/asia-pacific-malware-share-by-type/
NTT Security. (2018). Share of malware detected across Asia Pacific in 2016/2017, by type. Statista. Statista Inc.. Accessed: July 12, 2025. https://www.statista.com/statistics/946831/asia-pacific-malware-share-by-type/
NTT Security. "Share of Malware Detected across Asia Pacific in 2016/2017, by Type." Statista, Statista Inc., 25 May 2018, https://www.statista.com/statistics/946831/asia-pacific-malware-share-by-type/
NTT Security, Share of malware detected across Asia Pacific in 2016/2017, by type Statista, https://www.statista.com/statistics/946831/asia-pacific-malware-share-by-type/ (last visited July 12, 2025)
Share of malware detected across Asia Pacific in 2016/2017, by type [Graph], NTT Security, May 25, 2018. [Online]. Available: https://www.statista.com/statistics/946831/asia-pacific-malware-share-by-type/