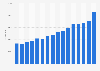
Net sales of Danish pharmaceutical company Novo Nordisk increased annually until 2016, when it reached around 111.8 billion Danish kroner, and then stagnated in 2017. In the period 2018-2024, net sales increased again, and reached a peak at over 290 billion Danish kroner in 2024.
Advertisement
Advertisement
Net sales of Novo Nordisk from 2009 to 2024
(in million DKK)
Characteristic
Net sales in million DKK
2024
290,403
2023
232,261
2022
176,954
2021
140,800
2020
126,946
2019
122,021
2018
111,831
2017
111,696
2016
111,780
2015
107,927
2014
88,806
2013
83,572
2012
78,026
050,000100,000150,000200,000250,000300,000350,000
Add this content to your personal favorites. These can be accessed from the favorites menu in the main navigation.
You have no right to use this feature.
Make sure to contact us if you are interested in scientific citation.
You can upgrade your account to enable this functionality for all statistics.
This feature is not available with your current account.Request access
Learn more about how Statista can support your business.
Novo Nordisk, & Company filings. (February 5, 2025). Net sales of Novo Nordisk from 2009 to 2024 (in million DKK) [Graph]. In Statista. Retrieved July 05, 2025, from https://www.statista.com/statistics/947601/net-sales-of-novo-nordisk/
Novo Nordisk, und Company filings. "Net sales of Novo Nordisk from 2009 to 2024 (in million DKK) ." Chart. February 5, 2025. Statista. Accessed July 05, 2025. https://www.statista.com/statistics/947601/net-sales-of-novo-nordisk/
Novo Nordisk, Company filings. (2025). Net sales of Novo Nordisk from 2009 to 2024 (in million DKK) . Statista. Statista Inc.. Accessed: July 05, 2025. https://www.statista.com/statistics/947601/net-sales-of-novo-nordisk/
Novo Nordisk, and Company filings. "Net Sales of Novo Nordisk from 2009 to 2024 (in Million Dkk) ." Statista, Statista Inc., 5 Feb 2025, https://www.statista.com/statistics/947601/net-sales-of-novo-nordisk/
Novo Nordisk & Company filings, Net sales of Novo Nordisk from 2009 to 2024 (in million DKK) Statista, https://www.statista.com/statistics/947601/net-sales-of-novo-nordisk/ (last visited July 05, 2025)
Net sales of Novo Nordisk from 2009 to 2024 (in million DKK) [Graph], Novo Nordisk, & Company filings, February 5, 2025. [Online]. Available: https://www.statista.com/statistics/947601/net-sales-of-novo-nordisk/
Advertisement
Profit from additional features with an Employee Account
Please create an employee account to be able to mark statistics as favorites.
Then you can access your favorite statistics via the star in the header.
Profit from the additional features of your individual account
Currently, you are using a shared account. To use individual functions (e.g., mark statistics as favourites, set
statistic alerts) please log in with your personal account.
If you are an admin, please authenticate by logging in again.