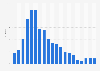
This statistic shows the average number of days taken to complete a foreclosure in the United States from the first quarter of 2007 to the third quarter of 2018. In the third quarter of 2018, foreclosures in the U.S. were completed, on average, in *** days.
Profit from the additional features of your individual account
Currently, you are using a shared account. To use individual functions (e.g., mark statistics as favourites, set
statistic alerts) please log in with your personal account.
If you are an admin, please authenticate by logging in again.
Learn more about how Statista can support your business.
Statista. (December 4, 2018). Average time taken to complete a foreclosure in the United States from Q1 2007 to Q3 2018 (in days) [Graph]. In Statista. Retrieved July 15, 2025, from https://www.statista.com/statistics/947629/foreclosure-completion-usa/
Statista. "Average time taken to complete a foreclosure in the United States from Q1 2007 to Q3 2018 (in days)." Chart. December 4, 2018. Statista. Accessed July 15, 2025. https://www.statista.com/statistics/947629/foreclosure-completion-usa/
Statista. (2018). Average time taken to complete a foreclosure in the United States from Q1 2007 to Q3 2018 (in days). Statista. Statista Inc.. Accessed: July 15, 2025. https://www.statista.com/statistics/947629/foreclosure-completion-usa/
Statista. "Average Time Taken to Complete a Foreclosure in The United States from Q1 2007 to Q3 2018 (in Days)." Statista, Statista Inc., 4 Dec 2018, https://www.statista.com/statistics/947629/foreclosure-completion-usa/
Statista, Average time taken to complete a foreclosure in the United States from Q1 2007 to Q3 2018 (in days) Statista, https://www.statista.com/statistics/947629/foreclosure-completion-usa/ (last visited July 15, 2025)
Average time taken to complete a foreclosure in the United States from Q1 2007 to Q3 2018 (in days) [Graph], Statista, December 4, 2018. [Online]. Available: https://www.statista.com/statistics/947629/foreclosure-completion-usa/