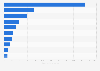
This statistic displays the export value distribution of steel mill products from South Korea year-to-date (YTD) through June 2018, by product. From January to June 2018, the share of flat products accounted for ** percent of the total value of steel mill products exported from South Korea.
Profit from the additional features of your individual account
Currently, you are using a shared account. To use individual functions (e.g., mark statistics as favourites, set
statistic alerts) please log in with your personal account.
If you are an admin, please authenticate by logging in again.
Learn more about how Statista can support your business.
International Trade Administration. (September 27, 2018). Export value distribution of steel mill products from South Korea year-to-date (YTD) through June 2018, by product value [Graph]. In Statista. Retrieved July 27, 2025, from https://www.statista.com/statistics/948623/south-korea-steel-mill-products-export-value-share-by-product/
International Trade Administration. "Export value distribution of steel mill products from South Korea year-to-date (YTD) through June 2018, by product value." Chart. September 27, 2018. Statista. Accessed July 27, 2025. https://www.statista.com/statistics/948623/south-korea-steel-mill-products-export-value-share-by-product/
International Trade Administration. (2018). Export value distribution of steel mill products from South Korea year-to-date (YTD) through June 2018, by product value. Statista. Statista Inc.. Accessed: July 27, 2025. https://www.statista.com/statistics/948623/south-korea-steel-mill-products-export-value-share-by-product/
International Trade Administration. "Export Value Distribution of Steel Mill Products from South Korea Year-to-date (Ytd) through June 2018, by Product Value." Statista, Statista Inc., 27 Sep 2018, https://www.statista.com/statistics/948623/south-korea-steel-mill-products-export-value-share-by-product/
International Trade Administration, Export value distribution of steel mill products from South Korea year-to-date (YTD) through June 2018, by product value Statista, https://www.statista.com/statistics/948623/south-korea-steel-mill-products-export-value-share-by-product/ (last visited July 27, 2025)
Export value distribution of steel mill products from South Korea year-to-date (YTD) through June 2018, by product value [Graph], International Trade Administration, September 27, 2018. [Online]. Available: https://www.statista.com/statistics/948623/south-korea-steel-mill-products-export-value-share-by-product/