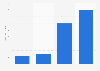
The sharing economy market in Russia has experienced accelerated growth over the observed years. Marking 50 and 39 percent growth rates in 2019 and 2020, respectively, relative to previous periods.
Advertisement
Advertisement
Sharing economy market value in Russia from 2017 to 2020
(in billion Russian rubles)
Characteristic
Transaction in billion Russian rubles
2020
1,070
2019
769.5
2018
511
2017
392
02004006008001,0001,200
Add this content to your personal favorites. These can be accessed from the favorites menu in the main navigation.
You have no right to use this feature.
Make sure to contact us if you are interested in scientific citation.
You can upgrade your account to enable this functionality for all statistics.
This feature is not available with your current account.Request access
According to the methodology, estimates for the Russian sharing market were based on the following key sharing verticals: car sharing, carpooling, short-term lease of residential and office property, crowdfunding, C2C sales of goods, P2P rentals of goods, and online marketplaces for self-employed service providers.
Learn more about how Statista can support your business.
TIARCENTER. (February 18, 2021). Sharing economy market value in Russia from 2017 to 2020 (in billion Russian rubles) [Graph]. In Statista. Retrieved July 04, 2025, from https://www.statista.com/statistics/951188/sharing-economy-transactions-in-russia/
TIARCENTER. "Sharing economy market value in Russia from 2017 to 2020 (in billion Russian rubles)." Chart. February 18, 2021. Statista. Accessed July 04, 2025. https://www.statista.com/statistics/951188/sharing-economy-transactions-in-russia/
TIARCENTER. (2021). Sharing economy market value in Russia from 2017 to 2020 (in billion Russian rubles). Statista. Statista Inc.. Accessed: July 04, 2025. https://www.statista.com/statistics/951188/sharing-economy-transactions-in-russia/
TIARCENTER. "Sharing Economy Market Value in Russia from 2017 to 2020 (in Billion Russian Rubles)." Statista, Statista Inc., 18 Feb 2021, https://www.statista.com/statistics/951188/sharing-economy-transactions-in-russia/
TIARCENTER, Sharing economy market value in Russia from 2017 to 2020 (in billion Russian rubles) Statista, https://www.statista.com/statistics/951188/sharing-economy-transactions-in-russia/ (last visited July 04, 2025)
Sharing economy market value in Russia from 2017 to 2020 (in billion Russian rubles) [Graph], TIARCENTER, February 18, 2021. [Online]. Available: https://www.statista.com/statistics/951188/sharing-economy-transactions-in-russia/
Advertisement
Profit from additional features with an Employee Account
Please create an employee account to be able to mark statistics as favorites.
Then you can access your favorite statistics via the star in the header.
Profit from the additional features of your individual account
Currently, you are using a shared account. To use individual functions (e.g., mark statistics as favourites, set
statistic alerts) please log in with your personal account.
If you are an admin, please authenticate by logging in again.