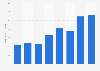
In 2019, the volume of port container throughput at Kwai Tsing Container Terminals amounted to 14 million TEUs which constitutes an eight percent decrease to the previous year. The majority of container throughput originated from seaborn transportation.
Advertisement
Advertisement
Port container throughput volume in Hong Kong from 2012 to 2019, by berthing location
(in million TEUs)
Profit from the additional features of your individual account
Currently, you are using a shared account. To use individual functions (e.g., mark statistics as favourites, set
statistic alerts) please log in with your personal account.
If you are an admin, please authenticate by logging in again.
Learn more about how Statista can support your business.
Marine Department (Hong Kong). (May 26, 2020). Port container throughput volume in Hong Kong from 2012 to 2019, by berthing location (in million TEUs) [Graph]. In Statista. Retrieved June 24, 2025, from https://www.statista.com/statistics/951894/hong-kong-port-container-throughput-by-berthing-location/
Marine Department (Hong Kong). "Port container throughput volume in Hong Kong from 2012 to 2019, by berthing location (in million TEUs)." Chart. May 26, 2020. Statista. Accessed June 24, 2025. https://www.statista.com/statistics/951894/hong-kong-port-container-throughput-by-berthing-location/
Marine Department (Hong Kong). (2020). Port container throughput volume in Hong Kong from 2012 to 2019, by berthing location (in million TEUs). Statista. Statista Inc.. Accessed: June 24, 2025. https://www.statista.com/statistics/951894/hong-kong-port-container-throughput-by-berthing-location/
Marine Department (Hong Kong). "Port Container Throughput Volume in Hong Kong from 2012 to 2019, by Berthing Location (in Million Teus)." Statista, Statista Inc., 26 May 2020, https://www.statista.com/statistics/951894/hong-kong-port-container-throughput-by-berthing-location/
Marine Department (Hong Kong), Port container throughput volume in Hong Kong from 2012 to 2019, by berthing location (in million TEUs) Statista, https://www.statista.com/statistics/951894/hong-kong-port-container-throughput-by-berthing-location/ (last visited June 24, 2025)
Port container throughput volume in Hong Kong from 2012 to 2019, by berthing location (in million TEUs) [Graph], Marine Department (Hong Kong), May 26, 2020. [Online]. Available: https://www.statista.com/statistics/951894/hong-kong-port-container-throughput-by-berthing-location/