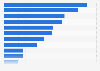
This statistic depicts the estimated prevalence of vision loss in Italy from 2010 to 2017. Near vision loss was the most common type of vision loss among Italians. In 2017, approximately 6,092 individuals out of 100,000 were suffering from it.
Profit from the additional features of your individual account
Currently, you are using a shared account. To use individual functions (e.g., mark statistics as favourites, set
statistic alerts) please log in with your personal account.
If you are an admin, please authenticate by logging in again.
Learn more about how Statista can support your business.
IHME. (November 1, 2018). Prevalence of vision loss in Italy from 2010 to 2017 (per 100,000 population) [Graph]. In Statista. Retrieved June 20, 2025, from https://www.statista.com/statistics/955981/prevalence-of-vision-loss-in-italy/
IHME. "Prevalence of vision loss in Italy from 2010 to 2017 (per 100,000 population)." Chart. November 1, 2018. Statista. Accessed June 20, 2025. https://www.statista.com/statistics/955981/prevalence-of-vision-loss-in-italy/
IHME. (2018). Prevalence of vision loss in Italy from 2010 to 2017 (per 100,000 population). Statista. Statista Inc.. Accessed: June 20, 2025. https://www.statista.com/statistics/955981/prevalence-of-vision-loss-in-italy/
IHME. "Prevalence of Vision Loss in Italy from 2010 to 2017 (per 100,000 Population)." Statista, Statista Inc., 1 Nov 2018, https://www.statista.com/statistics/955981/prevalence-of-vision-loss-in-italy/
IHME, Prevalence of vision loss in Italy from 2010 to 2017 (per 100,000 population) Statista, https://www.statista.com/statistics/955981/prevalence-of-vision-loss-in-italy/ (last visited June 20, 2025)
Prevalence of vision loss in Italy from 2010 to 2017 (per 100,000 population) [Graph], IHME, November 1, 2018. [Online]. Available: https://www.statista.com/statistics/955981/prevalence-of-vision-loss-in-italy/