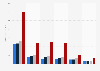
In 2022, e-commerce added 599 billion U.S. dollars in value to the overall U.S. economy. During that year, the GDP of the United States amounted to 25.46 trillion U.S. dollars with a digital economy value added of 2.57 trillion U.S. dollars.
Value added to the total economy (GDP) by the digital economy in the United States from 2005 to 2022, by commodity
(in billion U.S. dollars)
Notes: Value added by commodity is prepared by (1) calculating ratios of commodity output to total industry output for each industry and digital commodity, (2) applying these ratios to each industry’s value added, and (3) aggregating the result by digital commodity.
These estimates are based on data valued in producers’ prices and exclude transportation costs and wholesale and retail trade markups, with the exception of retail trade markups associated with e-commerce transactions.
Values regarding periods earlier than 2017 are from a previous publication.
Profit from the additional features of your individual account
Currently, you are using a shared account. To use individual functions (e.g., mark statistics as favourites, set
statistic alerts) please log in with your personal account.
If you are an admin, please authenticate by logging in again.
Learn more about how Statista can support your business.
BEA. (December 6, 2023). Value added to the total economy (GDP) by the digital economy in the United States from 2005 to 2022, by commodity (in billion U.S. dollars) [Graph]. In Statista. Retrieved June 06, 2025, from https://www.statista.com/statistics/961946/digital-economy-value-add-to-gdp-commodity/
BEA. "Value added to the total economy (GDP) by the digital economy in the United States from 2005 to 2022, by commodity (in billion U.S. dollars)." Chart. December 6, 2023. Statista. Accessed June 06, 2025. https://www.statista.com/statistics/961946/digital-economy-value-add-to-gdp-commodity/
BEA. (2023). Value added to the total economy (GDP) by the digital economy in the United States from 2005 to 2022, by commodity (in billion U.S. dollars). Statista. Statista Inc.. Accessed: June 06, 2025. https://www.statista.com/statistics/961946/digital-economy-value-add-to-gdp-commodity/
BEA. "Value Added to The Total Economy (Gdp) by The Digital Economy in The United States from 2005 to 2022, by Commodity (in Billion U.S. Dollars)." Statista, Statista Inc., 6 Dec 2023, https://www.statista.com/statistics/961946/digital-economy-value-add-to-gdp-commodity/
BEA, Value added to the total economy (GDP) by the digital economy in the United States from 2005 to 2022, by commodity (in billion U.S. dollars) Statista, https://www.statista.com/statistics/961946/digital-economy-value-add-to-gdp-commodity/ (last visited June 06, 2025)
Value added to the total economy (GDP) by the digital economy in the United States from 2005 to 2022, by commodity (in billion U.S. dollars) [Graph], BEA, December 6, 2023. [Online]. Available: https://www.statista.com/statistics/961946/digital-economy-value-add-to-gdp-commodity/