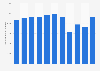
This statistic shows the annual vehicular flow through the Shing Mun Tunnels in Hong Kong from 2013 to 2019. In 2019, more than 19 million vehicles passed though the Shing Mun Tunnels in Hong Kong.
Annual vehicular flow through the Shing Mun Tunnels in Hong Kong from 2013 to 2019
(in 1,000s)
Profit from the additional features of your individual account
Currently, you are using a shared account. To use individual functions (e.g., mark statistics as favourites, set
statistic alerts) please log in with your personal account.
If you are an admin, please authenticate by logging in again.
Learn more about how Statista can support your business.
GovHK. (January 14, 2021). Annual vehicular flow through the Shing Mun Tunnels in Hong Kong from 2013 to 2019 (in 1,000s) [Graph]. In Statista. Retrieved June 07, 2025, from https://www.statista.com/statistics/964026/hong-kong-annual-vehicular-flow-through-the-shing-mun-tunnels/
GovHK. "Annual vehicular flow through the Shing Mun Tunnels in Hong Kong from 2013 to 2019 (in 1,000s)." Chart. January 14, 2021. Statista. Accessed June 07, 2025. https://www.statista.com/statistics/964026/hong-kong-annual-vehicular-flow-through-the-shing-mun-tunnels/
GovHK. (2021). Annual vehicular flow through the Shing Mun Tunnels in Hong Kong from 2013 to 2019 (in 1,000s). Statista. Statista Inc.. Accessed: June 07, 2025. https://www.statista.com/statistics/964026/hong-kong-annual-vehicular-flow-through-the-shing-mun-tunnels/
GovHK. "Annual Vehicular Flow through The Shing Mun Tunnels in Hong Kong from 2013 to 2019 (in 1,000s)." Statista, Statista Inc., 14 Jan 2021, https://www.statista.com/statistics/964026/hong-kong-annual-vehicular-flow-through-the-shing-mun-tunnels/
GovHK, Annual vehicular flow through the Shing Mun Tunnels in Hong Kong from 2013 to 2019 (in 1,000s) Statista, https://www.statista.com/statistics/964026/hong-kong-annual-vehicular-flow-through-the-shing-mun-tunnels/ (last visited June 07, 2025)
Annual vehicular flow through the Shing Mun Tunnels in Hong Kong from 2013 to 2019 (in 1,000s) [Graph], GovHK, January 14, 2021. [Online]. Available: https://www.statista.com/statistics/964026/hong-kong-annual-vehicular-flow-through-the-shing-mun-tunnels/