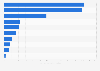
The age distribution of Accor Group employees experienced little change from 2022 to 2023. In 2023, 35 percent of Accor Group employees were within the age range of 25 to 34 and only eight percent were over 55. Both of these figures remained consistent with the previous year.
Share of Accor Group employees worldwide from 2016 to 2023, by age
Profit from the additional features of your individual account
Currently, you are using a shared account. To use individual functions (e.g., mark statistics as favourites, set
statistic alerts) please log in with your personal account.
If you are an admin, please authenticate by logging in again.
Learn more about how Statista can support your business.
Accor. (February 4, 2024). Share of Accor Group employees worldwide from 2016 to 2023, by age [Graph]. In Statista. Retrieved May 18, 2025, from https://www.statista.com/statistics/966814/accor-group-age-of-employees/
Accor. "Share of Accor Group employees worldwide from 2016 to 2023, by age." Chart. February 4, 2024. Statista. Accessed May 18, 2025. https://www.statista.com/statistics/966814/accor-group-age-of-employees/
Accor. (2024). Share of Accor Group employees worldwide from 2016 to 2023, by age. Statista. Statista Inc.. Accessed: May 18, 2025. https://www.statista.com/statistics/966814/accor-group-age-of-employees/
Accor. "Share of Accor Group Employees Worldwide from 2016 to 2023, by Age." Statista, Statista Inc., 4 Feb 2024, https://www.statista.com/statistics/966814/accor-group-age-of-employees/
Accor, Share of Accor Group employees worldwide from 2016 to 2023, by age Statista, https://www.statista.com/statistics/966814/accor-group-age-of-employees/ (last visited May 18, 2025)
Share of Accor Group employees worldwide from 2016 to 2023, by age [Graph], Accor, February 4, 2024. [Online]. Available: https://www.statista.com/statistics/966814/accor-group-age-of-employees/