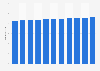
This statistic presents number of days with precipitation in Bern, Switzerland per calendar month in 2018. According to data provided by LAL, in May there were 13 rainy days, the highest figure when compared with only 9 days in February and September.
Profit from the additional features of your individual account
Currently, you are using a shared account. To use individual functions (e.g., mark statistics as favourites, set
statistic alerts) please log in with your personal account.
If you are an admin, please authenticate by logging in again.
Learn more about how Statista can support your business.
LAL Sprachreisen. (December 4, 2018). Number of days with precipitation in Bern in Switzerland from January to December 2018 [Graph]. In Statista. Retrieved May 13, 2025, from https://www.statista.com/statistics/968098/number-of-rainy-days-in-bern/
LAL Sprachreisen. "Number of days with precipitation in Bern in Switzerland from January to December 2018." Chart. December 4, 2018. Statista. Accessed May 13, 2025. https://www.statista.com/statistics/968098/number-of-rainy-days-in-bern/
LAL Sprachreisen. (2018). Number of days with precipitation in Bern in Switzerland from January to December 2018. Statista. Statista Inc.. Accessed: May 13, 2025. https://www.statista.com/statistics/968098/number-of-rainy-days-in-bern/
LAL Sprachreisen. "Number of Days with Precipitation in Bern in Switzerland from January to December 2018." Statista, Statista Inc., 4 Dec 2018, https://www.statista.com/statistics/968098/number-of-rainy-days-in-bern/
LAL Sprachreisen, Number of days with precipitation in Bern in Switzerland from January to December 2018 Statista, https://www.statista.com/statistics/968098/number-of-rainy-days-in-bern/ (last visited May 13, 2025)
Number of days with precipitation in Bern in Switzerland from January to December 2018 [Graph], LAL Sprachreisen, December 4, 2018. [Online]. Available: https://www.statista.com/statistics/968098/number-of-rainy-days-in-bern/