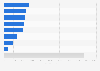
This statistic shows the net profit of Danish biotechnology company Genmab from 2009 to 2024. The company's net profit was negative from 2009 to 2012, but turned positive in 2013. Net profit peaked in 2024 at a value of around 7.8 billion Danish kroner.
Advertisement
Advertisement
Net profit of Genmab from 2009 to 2024
(in million DKK)
Profit from the additional features of your individual account
Currently, you are using a shared account. To use individual functions (e.g., mark statistics as favourites, set
statistic alerts) please log in with your personal account.
If you are an admin, please authenticate by logging in again.
Learn more about how Statista can support your business.
Genmab, & Nasdaq Nordic. (February 12, 2025). Net profit of Genmab from 2009 to 2024 (in million DKK) [Graph]. In Statista. Retrieved June 17, 2025, from https://www.statista.com/statistics/970459/annual-net-profit-of-genmab/
Genmab, und Nasdaq Nordic. "Net profit of Genmab from 2009 to 2024 (in million DKK) ." Chart. February 12, 2025. Statista. Accessed June 17, 2025. https://www.statista.com/statistics/970459/annual-net-profit-of-genmab/
Genmab, Nasdaq Nordic. (2025). Net profit of Genmab from 2009 to 2024 (in million DKK) . Statista. Statista Inc.. Accessed: June 17, 2025. https://www.statista.com/statistics/970459/annual-net-profit-of-genmab/
Genmab, and Nasdaq Nordic. "Net Profit of Genmab from 2009 to 2024 (in Million Dkk) ." Statista, Statista Inc., 12 Feb 2025, https://www.statista.com/statistics/970459/annual-net-profit-of-genmab/
Genmab & Nasdaq Nordic, Net profit of Genmab from 2009 to 2024 (in million DKK) Statista, https://www.statista.com/statistics/970459/annual-net-profit-of-genmab/ (last visited June 17, 2025)
Net profit of Genmab from 2009 to 2024 (in million DKK) [Graph], Genmab, & Nasdaq Nordic, February 12, 2025. [Online]. Available: https://www.statista.com/statistics/970459/annual-net-profit-of-genmab/