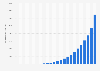
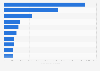
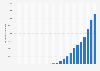
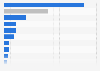
This statistic represents the capacity of commissioned co-located solar and energy storage projects in select states as of 2019. As of this time, there was 3.4 gigawatts of commissioned co-located solar and storage projects in California.
Advertisement
Advertisement
Capacity of commissioned co-located solar and storage projects in the U.S. in 2019, by select state
(in megawatts)
You have no right to use this feature.
Make sure to contact us if you are interested in scientific citation.
You can upgrade your account to enable this functionality for all statistics.
This feature is not available with your current account.Request access
Learn more about how Statista can support your business.
BloombergNEF, & BCSE. (February 7, 2020). Capacity of commissioned co-located solar and storage projects in the U.S. in 2019, by select state (in megawatts) [Graph]. In Statista. Retrieved June 17, 2025, from https://www.statista.com/statistics/971835/solar-pv-energy-storage-projects-us-state/
BloombergNEF, und BCSE. "Capacity of commissioned co-located solar and storage projects in the U.S. in 2019, by select state (in megawatts)." Chart. February 7, 2020. Statista. Accessed June 17, 2025. https://www.statista.com/statistics/971835/solar-pv-energy-storage-projects-us-state/
BloombergNEF, BCSE. (2020). Capacity of commissioned co-located solar and storage projects in the U.S. in 2019, by select state (in megawatts). Statista. Statista Inc.. Accessed: June 17, 2025. https://www.statista.com/statistics/971835/solar-pv-energy-storage-projects-us-state/
BloombergNEF, and BCSE. "Capacity of Commissioned Co-located Solar and Storage Projects in The U.S. in 2019, by Select State (in Megawatts)." Statista, Statista Inc., 7 Feb 2020, https://www.statista.com/statistics/971835/solar-pv-energy-storage-projects-us-state/
BloombergNEF & BCSE, Capacity of commissioned co-located solar and storage projects in the U.S. in 2019, by select state (in megawatts) Statista, https://www.statista.com/statistics/971835/solar-pv-energy-storage-projects-us-state/ (last visited June 17, 2025)
Capacity of commissioned co-located solar and storage projects in the U.S. in 2019, by select state (in megawatts) [Graph], BloombergNEF, & BCSE, February 7, 2020. [Online]. Available: https://www.statista.com/statistics/971835/solar-pv-energy-storage-projects-us-state/
Advertisement
Profit from additional features with an Employee Account
Please create an employee account to be able to mark statistics as favorites.
Then you can access your favorite statistics via the star in the header.
Profit from the additional features of your individual account
Currently, you are using a shared account. To use individual functions (e.g., mark statistics as favourites, set
statistic alerts) please log in with your personal account.
If you are an admin, please authenticate by logging in again.