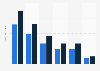
This statistic displays the change in the sales value of canned food in Canada in 2018, by category. For the 52 weeks ending December 8, 2018, sales of canned peas and beans increased by *** percent compared to the previous year.
Profit from the additional features of your individual account
Currently, you are using a shared account. To use individual functions (e.g., mark statistics as favourites, set
statistic alerts) please log in with your personal account.
If you are an admin, please authenticate by logging in again.
Learn more about how Statista can support your business.
Canadian Grocer. (February 1, 2019). Percentage change in the sales value of canned food in Canada in 2018, by category [Graph]. In Statista. Retrieved July 12, 2025, from https://www.statista.com/statistics/974557/canned-food-sales-value-growth-canada/
Canadian Grocer. "Percentage change in the sales value of canned food in Canada in 2018, by category ." Chart. February 1, 2019. Statista. Accessed July 12, 2025. https://www.statista.com/statistics/974557/canned-food-sales-value-growth-canada/
Canadian Grocer. (2019). Percentage change in the sales value of canned food in Canada in 2018, by category . Statista. Statista Inc.. Accessed: July 12, 2025. https://www.statista.com/statistics/974557/canned-food-sales-value-growth-canada/
Canadian Grocer. "Percentage Change in The Sales Value of Canned Food in Canada in 2018, by Category ." Statista, Statista Inc., 1 Feb 2019, https://www.statista.com/statistics/974557/canned-food-sales-value-growth-canada/
Canadian Grocer, Percentage change in the sales value of canned food in Canada in 2018, by category Statista, https://www.statista.com/statistics/974557/canned-food-sales-value-growth-canada/ (last visited July 12, 2025)
Percentage change in the sales value of canned food in Canada in 2018, by category [Graph], Canadian Grocer, February 1, 2019. [Online]. Available: https://www.statista.com/statistics/974557/canned-food-sales-value-growth-canada/