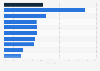
This statistic presents the number of nuisance calls received in the United Kingdom in 2016, by frequency of calls per month. During this year, 28 percent of people had 11 to 20 nuisance calls per month, while ten percent had over 60.
Profit from the additional features of your individual account
Currently, you are using a shared account. To use individual functions (e.g., mark statistics as favourites, set
statistic alerts) please log in with your personal account.
If you are an admin, please authenticate by logging in again.
Learn more about how Statista can support your business.
Which?. (October 1, 2016). Average number of nuisance calls people received per month in the United Kingdom (UK) in 2016 [Graph]. In Statista. Retrieved June 07, 2025, from https://www.statista.com/statistics/975043/average-number-of-nuisance-calls-in-the-uk/
Which?. "Average number of nuisance calls people received per month in the United Kingdom (UK) in 2016." Chart. October 1, 2016. Statista. Accessed June 07, 2025. https://www.statista.com/statistics/975043/average-number-of-nuisance-calls-in-the-uk/
Which?. (2016). Average number of nuisance calls people received per month in the United Kingdom (UK) in 2016. Statista. Statista Inc.. Accessed: June 07, 2025. https://www.statista.com/statistics/975043/average-number-of-nuisance-calls-in-the-uk/
Which?. "Average Number of Nuisance Calls People Received per Month in The United Kingdom (Uk) in 2016." Statista, Statista Inc., 1 Oct 2016, https://www.statista.com/statistics/975043/average-number-of-nuisance-calls-in-the-uk/
Which?, Average number of nuisance calls people received per month in the United Kingdom (UK) in 2016 Statista, https://www.statista.com/statistics/975043/average-number-of-nuisance-calls-in-the-uk/ (last visited June 07, 2025)
Average number of nuisance calls people received per month in the United Kingdom (UK) in 2016 [Graph], Which?, October 1, 2016. [Online]. Available: https://www.statista.com/statistics/975043/average-number-of-nuisance-calls-in-the-uk/