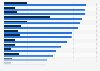
This statistic shows Abbott Laboratories' revenue of the Diagnostics segment from 2020 to 2024, broken down by category. In 2024, the Rapid Diagnostics category within this segment generated nearly three billion U.S. dollars, a significant decrease from the preceding years. The extraordinary growth witnessed in this segment was in large part an increased demand for COVID-19 tests since the beginning of the pandemic.
Advertisement
Advertisement
Abbott Laboratories' Diagnostics segment revenue from 2020 to 2024, by category
(in million U.S. dollars)
Characteristic
Rapid Diagnostics
Core Laboratory
Molecular
Point of Care
2020
4,376
4,475
1,438
516
2021
8,553
5,128
1,427
536
2022
10,716
4,888
995
525
2023
3,690
5,159
574
565
2024
2,997
5,235
521
588
05,00010,00015,00020,000
Add this content to your personal favorites. These can be accessed from the favorites menu in the main navigation.
You have no right to use this feature.
Make sure to contact us if you are interested in scientific citation.
You can upgrade your account to enable this functionality for all statistics.
This feature is not available with your current account.Request access
Learn more about how Statista can support your business.
Abbott Laboratories. (February 21, 2025). Abbott Laboratories' Diagnostics segment revenue from 2020 to 2024, by category (in million U.S. dollars) [Graph]. In Statista. Retrieved June 17, 2025, from https://www.statista.com/statistics/975520/abbott-s-diagnostics-segment-revenue-by-category/
Abbott Laboratories. "Abbott Laboratories' Diagnostics segment revenue from 2020 to 2024, by category (in million U.S. dollars)." Chart. February 21, 2025. Statista. Accessed June 17, 2025. https://www.statista.com/statistics/975520/abbott-s-diagnostics-segment-revenue-by-category/
Abbott Laboratories. (2025). Abbott Laboratories' Diagnostics segment revenue from 2020 to 2024, by category (in million U.S. dollars). Statista. Statista Inc.. Accessed: June 17, 2025. https://www.statista.com/statistics/975520/abbott-s-diagnostics-segment-revenue-by-category/
Abbott Laboratories. "Abbott Laboratories' Diagnostics Segment Revenue from 2020 to 2024, by Category (in Million U.S. Dollars)." Statista, Statista Inc., 21 Feb 2025, https://www.statista.com/statistics/975520/abbott-s-diagnostics-segment-revenue-by-category/
Abbott Laboratories, Abbott Laboratories' Diagnostics segment revenue from 2020 to 2024, by category (in million U.S. dollars) Statista, https://www.statista.com/statistics/975520/abbott-s-diagnostics-segment-revenue-by-category/ (last visited June 17, 2025)
Abbott Laboratories' Diagnostics segment revenue from 2020 to 2024, by category (in million U.S. dollars) [Graph], Abbott Laboratories, February 21, 2025. [Online]. Available: https://www.statista.com/statistics/975520/abbott-s-diagnostics-segment-revenue-by-category/
Advertisement
Profit from additional features with an Employee Account
Please create an employee account to be able to mark statistics as favorites.
Then you can access your favorite statistics via the star in the header.
Profit from the additional features of your individual account
Currently, you are using a shared account. To use individual functions (e.g., mark statistics as favourites, set
statistic alerts) please log in with your personal account.
If you are an admin, please authenticate by logging in again.