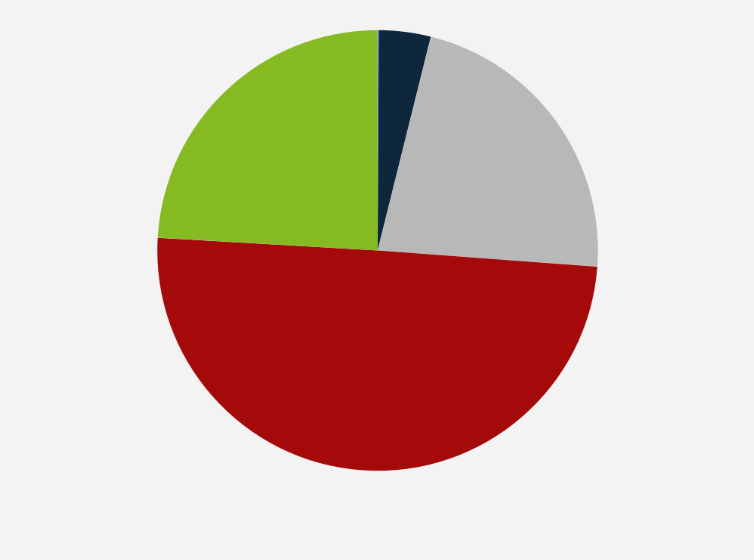
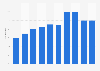
This statistic shows the distribution of cross-border import e-commerce customers in China as of March 2018, by age group. During the survey period, almost half of all cross-border import e-commerce shoppers were between 29 and 39 years old.
Advertisement
Advertisement
Distribution of cross-border import e-commerce customers in China as of March 2018, by age group
Adjust the presentation of the statistic and data points.
Share the statistic on social media channels or embed the statistic in your
website using "Embed Code", where available.
Cite this statistic and select one of the following formats: APA, Chicago, Harvard, MLA & Bluebook.
Print the statistic including description and metadata.
Chart type
Distribution of cross-border import e-commerce customers in China as of March 2018, by age group
Share this statistic
You have no right to use this feature.
Make sure to contact us if you are interested in scientific citation.
You can upgrade your account to enable this functionality for all statistics.
This feature is not available with your current account.Request access
Learn more about how Statista can support your business.
Fung Business Intelligence Centre . (October 15, 2018). Distribution of cross-border import e-commerce customers in China as of March 2018, by age group [Graph]. In Statista. Retrieved June 24, 2025, from https://www.statista.com/statistics/991929/china-share-of-cross-border-import-ecommerce-shoppers-by-age-group/
Fung Business Intelligence Centre . "Distribution of cross-border import e-commerce customers in China as of March 2018, by age group." Chart. October 15, 2018. Statista. Accessed June 24, 2025. https://www.statista.com/statistics/991929/china-share-of-cross-border-import-ecommerce-shoppers-by-age-group/
Fung Business Intelligence Centre . (2018). Distribution of cross-border import e-commerce customers in China as of March 2018, by age group. Statista. Statista Inc.. Accessed: June 24, 2025. https://www.statista.com/statistics/991929/china-share-of-cross-border-import-ecommerce-shoppers-by-age-group/
Fung Business Intelligence Centre . "Distribution of Cross-border Import E-commerce Customers in China as of March 2018, by Age Group." Statista, Statista Inc., 15 Oct 2018, https://www.statista.com/statistics/991929/china-share-of-cross-border-import-ecommerce-shoppers-by-age-group/
Fung Business Intelligence Centre , Distribution of cross-border import e-commerce customers in China as of March 2018, by age group Statista, https://www.statista.com/statistics/991929/china-share-of-cross-border-import-ecommerce-shoppers-by-age-group/ (last visited June 24, 2025)
Distribution of cross-border import e-commerce customers in China as of March 2018, by age group [Graph], Fung Business Intelligence Centre , October 15, 2018. [Online]. Available: https://www.statista.com/statistics/991929/china-share-of-cross-border-import-ecommerce-shoppers-by-age-group/
Advertisement
Profit from additional features with an Employee Account
Please create an employee account to be able to mark statistics as favorites.
Then you can access your favorite statistics via the star in the header.
Profit from the additional features of your individual account
Currently, you are using a shared account. To use individual functions (e.g., mark statistics as favourites, set
statistic alerts) please log in with your personal account.
If you are an admin, please authenticate by logging in again.