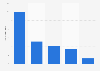
This statistic shows the frequency of visits to the vet in urban Peru as of August 2018, broken down by pet. During a survey, 75.5 percent of the respondent dog owners in Peru said they took their dog to the vet at least once a year.
Profit from the additional features of your individual account
Currently, you are using a shared account. To use individual functions (e.g., mark statistics as favourites, set
statistic alerts) please log in with your personal account.
If you are an admin, please authenticate by logging in again.
Learn more about how Statista can support your business.
CPI. (October 15, 2018). Frequency of visits to the vet in urban Peru as of August 2018, by pet [Graph]. In Statista. Retrieved June 03, 2025, from https://www.statista.com/statistics/994769/veterinary-visits-frequency-peru-pets/
CPI. "Frequency of visits to the vet in urban Peru as of August 2018, by pet." Chart. October 15, 2018. Statista. Accessed June 03, 2025. https://www.statista.com/statistics/994769/veterinary-visits-frequency-peru-pets/
CPI. (2018). Frequency of visits to the vet in urban Peru as of August 2018, by pet. Statista. Statista Inc.. Accessed: June 03, 2025. https://www.statista.com/statistics/994769/veterinary-visits-frequency-peru-pets/
CPI. "Frequency of Visits to The Vet in Urban Peru as of August 2018, by Pet." Statista, Statista Inc., 15 Oct 2018, https://www.statista.com/statistics/994769/veterinary-visits-frequency-peru-pets/
CPI, Frequency of visits to the vet in urban Peru as of August 2018, by pet Statista, https://www.statista.com/statistics/994769/veterinary-visits-frequency-peru-pets/ (last visited June 03, 2025)
Frequency of visits to the vet in urban Peru as of August 2018, by pet [Graph], CPI, October 15, 2018. [Online]. Available: https://www.statista.com/statistics/994769/veterinary-visits-frequency-peru-pets/